
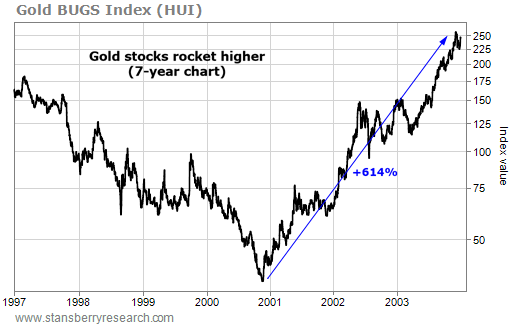
In the earliest stages of big gold rallies and bull markets, gold stocks tend to outperform…
And they outperform in a big way.
This is an important point in analyzing where the precious metal stands today… and what it could mean for your profits in gold stocks going forward.
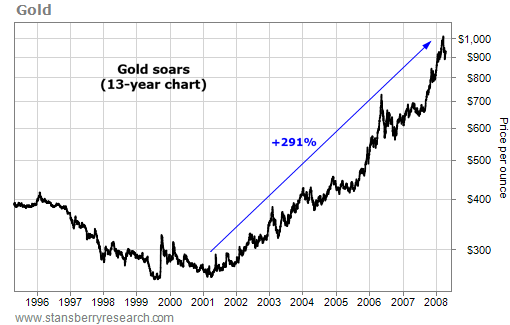
To get a little historical context, let's start by looking at the great gold bull market of the 2000s…
On April 2, 2001, gold bottomed at $256.60 an ounce. It was the lowest price in 20 months… and just 1% above its lowest price in more than 20 years. Over the next seven years, gold soared 291%.
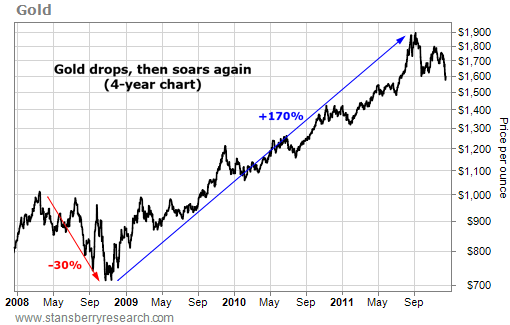
Fast-forward to 2008. Gold peaked at just above $1,000 an ounce. This was, as we said, 291% above its 2001 low. It then fell 30% during the financial crisis… before continuing its bull market. It soared to $1,900 an ounce… 170% off its 2008 low.
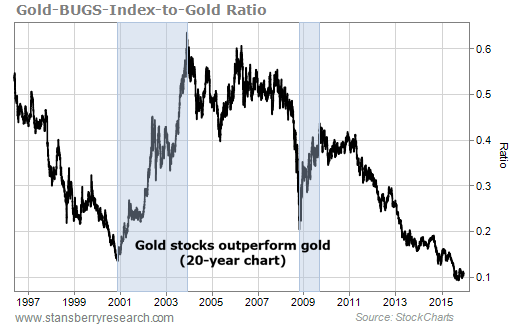
Well… let's take a look at all this information in a different way. It's called the "gold-stocks-to-gold ratio." Most folks don't look at ratio charts like these… But they can be extremely valuable.
In the long-term chart below, you can see how gold stocks have performed relative to gold. When the ratio is climbing, it means gold stocks are outperforming gold. When the ratio is falling, it means gold stocks are underperforming gold.
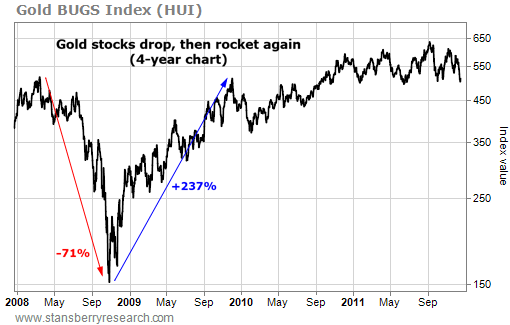
There are two periods that stand out. The period from late 2000 through late 2003… and the period from late 2008 through late 2009. These are the periods in the second and fourth charts above, when gold stocks far outperformed gold.
As you can see in the chart below, gold stocks have outperformed gold over the last three months. The ratio may be starting an uptrend.
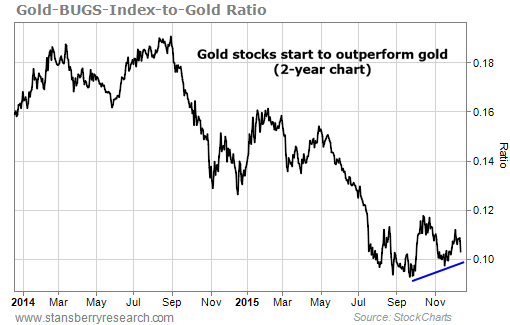
If it doesn't, it's probably best to hold off on new gold-stock purchases for now.
An uptrend in the gold-stocks-to-gold ratio is an indicator that's not on most folks' radars… But it often signals fantastic times to get into gold stocks.
Regards,
Brian Hunt and Ben Morris
No comments:
Post a Comment