Sunday, December 27, 2015

Gold Stocks Have NEVER Been This Cheap…

By Steve Sjuggerud, editor, True Wealth

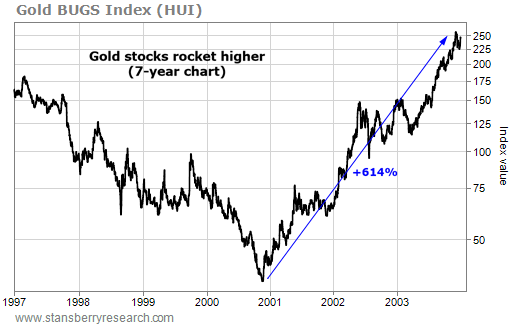
Gold stocks soared 600% from 2000 to 2004…

Before then, gold stocks had fallen 84% from 1996 to 2000.

The question is, are gold stocks cheaper today than they were back then?

The answer is YES. Let me explain…

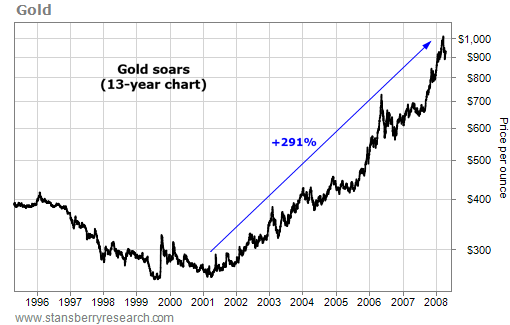
Most investors know that gold is far from its 2011 highs. But I don't think folks understand how far gold stocks have fallen.

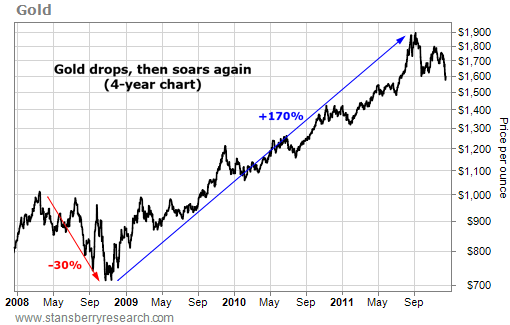
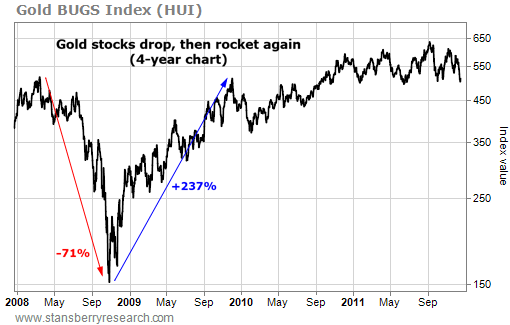
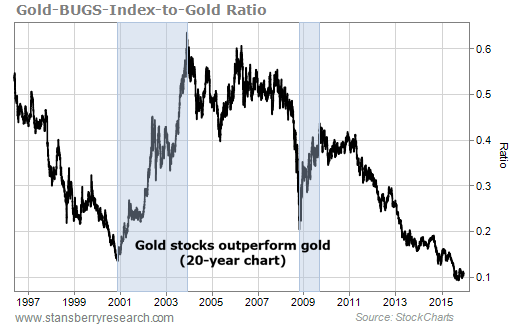
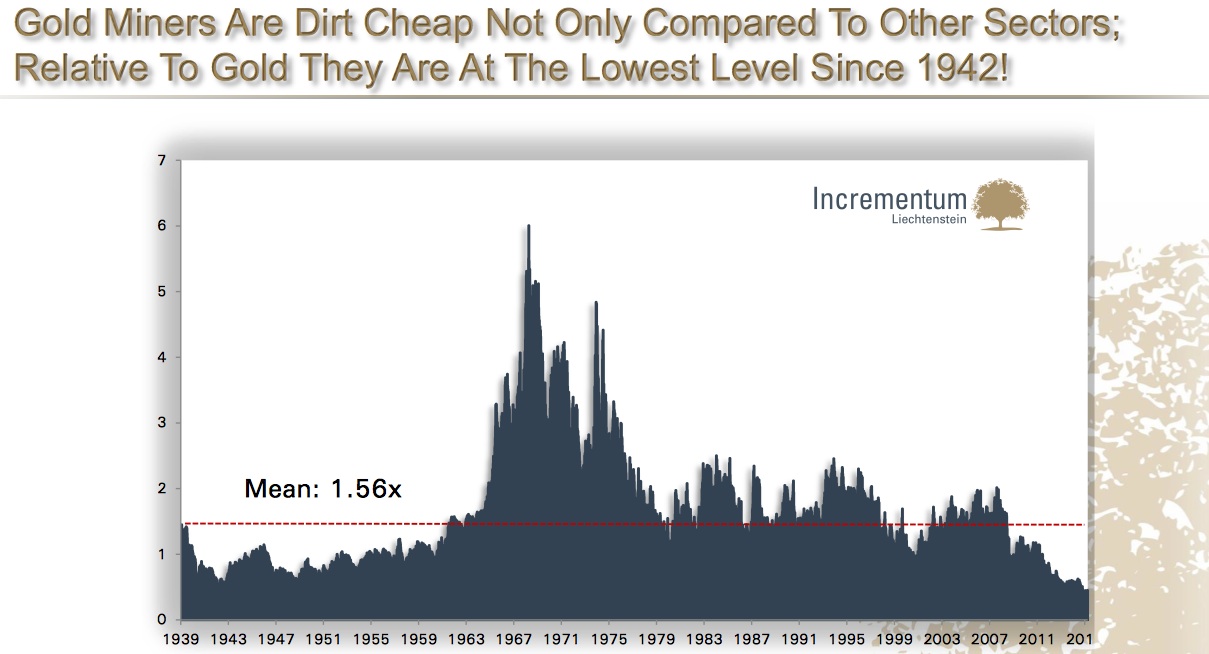
The benchmark gold-stocks index – the NYSE Arca Gold Bugs Index ("HUI") – is down more than 75% in four years. Meanwhile, the price of gold only fell around 30% in four years. That's a big divergence. And it has led to a major extreme in the gold-to-gold-stocks ratio.

This ratio is simple… It's the price of the HUI Index divided by the price of gold. Gold stocks are cheap compared with the price of gold when the ratio is low. And they're expensive relative to gold when the ratio is high.

With gold stocks crashing 75% and gold only falling 30%, this ratio recently hit an all-time low. Take a look…

 
This ratio hit an all-time low in October 2000. It took another 14 years – until last October – before it reached a new all-time low. It has reached new lows consistently since this past June.

Of course, this isn't a perfect "value" measure for gold stocks. It doesn't take mining costs into account – or any other business costs, for that matter. But it does offer a simple, big- picture view of the industry.

Importantly, the two major bottoms in this ratio led to incredible returns. You can see these bottoms clearly on the above chart – in 2000 and 2008.

If you'd bought gold stocks at each of those bottoms and held for three years, you would have made 418% and 226%, respectively.

We can't know exactly when we've hit bottom. But this shows how much gold stocks can soar when they get going. And after a 75% decline, these kinds of gains are absolutely possible when the next move higher begins.

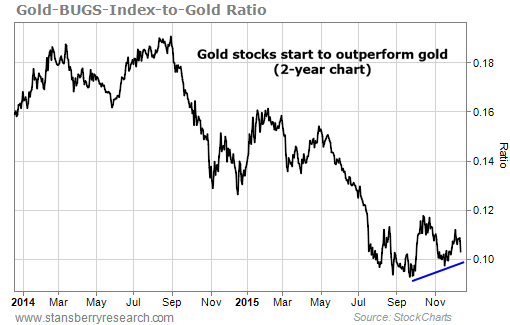
Importantly, the next move could be here – today. The easiest way to own gold stocks is through the Market Vectors Gold Miners Fund (GDX). It's up slightly since September's low.

We can't know for sure if this is the next big move in gold stocks. But they've been crashing for four years, they're now dirt-cheap, and in the last month they've been moving higher.

This is a somewhat risky bet. But consider shares of GDX today. This is exactly the setup I look for when investing. Check it out.

Good investing,

Steve Sjuggerud

A Hidden Indicator for Gold… And What It Means for Gold Stocks

By Brian Hunt and Ben Morris, co-editors, DailyWealth Trader

In the earliest stages of big gold rallies and bull markets, gold stocks tend to outperform…

And they outperform in a big way.

This is an important point in analyzing where the precious metal stands today… and what it could mean for your profits in gold stocks going forward.

To get a little historical context, let's start by looking at the great gold bull market of the 2000s…

On April 2, 2001, gold bottomed at $256.60 an ounce. It was the lowest price in 20 months… and just 1% above its lowest price in more than 20 years. Over the next seven years, gold soared 291%.

 
It was an incredible run. But by the beginning of that run, gold stocks had been rising for close to five months. By early December 2003, gold stocks had already risen 614%.

 
Gold stocks continued to rise through gold's 2008 peak… But these three years – which ended before gold had even doubled – saw the biggest, most rapid advances in gold stocks.

Fast-forward to 2008. Gold peaked at just above $1,000 an ounce. This was, as we said, 291% above its 2001 low. It then fell 30% during the financial crisis… before continuing its bull market. It soared to $1,900 an ounce… 170% off its 2008 low.

 
What happened to gold stocks? They fell harder. Then they ripped higher… again, in the early stages of gold's rise. By the time the price of gold had climbed 73% off its 2008 low, gold stocks were up 237%.

 
So you can see that two times in recent history, gold stocks have far outperformed gold in the early stages of multiyear gold rallies. But how does this help us understand where gold and gold stocks stand today?

Well… let's take a look at all this information in a different way. It's called the "gold-stocks-to-gold ratio." Most folks don't look at ratio charts like these… But they can be extremely valuable.

In the long-term chart below, you can see how gold stocks have performed relative to gold. When the ratio is climbing, it means gold stocks are outperforming gold. When the ratio is falling, it means gold stocks are underperforming gold.

There are two periods that stand out. The period from late 2000 through late 2003… and the period from late 2008 through late 2009. These are the periods in the second and fourth charts above, when gold stocks far outperformed gold.

 
If a major move higher in gold is about to get started, we would expect to see gold stocks outperforming gold. So let's look at what has been happening with the gold-stocks-to-gold ratio lately.

As you can see in the chart below, gold stocks have outperformed gold over the last three months. The ratio may be starting an uptrend.

 
This is a good sign. If the ratio continues to rise, we could be in the very early stages of the next big gold rally… and gold stocks could soar hundreds of percent.

If it doesn't, it's probably best to hold off on new gold-stock purchases for now.

An uptrend in the gold-stocks-to-gold ratio is an indicator that's not on most folks' radars… But it often signals fantastic times to get into gold stocks.

Regards,

Brian Hunt and Ben Morris

Wednesday, December 23, 2015

If You're So Rich, Why Do You Still Work?

If You're So Rich, Why Do You Still Work?
By Dr. Steve Sjuggerud
Wednesday, December 23, 2015 
I have a few friends who have "silly" wealth – more wealth than they could ever need or spend.

These guys are at retirement age or older… But for some reason, they work harder than just about anyone else I know…

Why are they working so hard? Isn't the dream to "bank" enough money so you don't have to work?

I called a few of these friends over the years and asked why. The answers were interesting…

One wealthy friend started out with this story to explain it… 

I had dinner with an extremely wealthy guy last week who's 71. He just retired to the desert in Palm Springs, supposedly to play some golf. I asked him how it was going…

"Retirement is horrible," he told me. He said, "I do NOT enjoy sitting in the desert doing nothing. I don't have a clue what I'm doing out here. I don't think I can do this. I don't need the money… But I think I'll have to go back to work."

My wealthy friend described the same feeling… "I love what I do," my friend told me. "I don't want to stop." 

I asked my friends specifically what it is that keeps them working so hard… 

One said, "Nothing in life beats the thrill of coming up with a big idea and making it a reality." 

Another said, "I like mentoring younger people… passing on what I do and seeing them succeed at it." 

A few more talked about the thrill of a great opportunity and the chance to increase their wealth. "I know there's no economic reason for me to work," one friend told me… "But that doesn't mean I don't like to get paid." 

I then asked these friends if they had any advice to help people join them in the "big leagues"… 

First, they explained, opportunity doesn't knock. You have to create it. And when opportunity is close by, you have to drop everything and pursue it. The more you make those sacrifices, the better your chances of finding financial success. 

Second, if you know more than everyone in the room, nobody can take advantage of you… So read a lot. Do more homework than anyone else at the table. 

Finally, one friend told me, "Work to the task, not to the reward." Don't wash a car for the $5 payment, for example… Wash a car because that's the task at hand – and do a fantastic job. Then you'll get noticed for your work and have a chance to move up in the world. 

So why do these "silly-rich" guys still work? And how can you get there, too? 

They work because they say it keeps them "alive"… 

"If I stop working, I'll die," one of them told me. My friends believe that finding success is all about recognizing, creating, and seizing opportunities. 

You make your own luck, they say, so create opportunities for yourself as best as you can. 

If you do that enough times in life, you'll know you're giving yourself a legitimate shot at success… at having the kind of wealth that means you're working because you love to, like my friends, not just working because you have to. 

Regards, 

Steve

Thursday, December 17, 2015

Why This Market Rally May Be Short-Lived

Why This Market Rally May Be Short-Lived
By Jeff Clark
Thursday, December 17, 2015
The year-end stock market rally got off to a good start on Tuesday.

All of the major stock indexes were up about 1%. And all the market sectors were higher, too.

The semiconductor sector jumped 1.5%. Bank stocks gained 3%. The biotechnology sector rallied 3.4%. Even the beaten-down oil sector surged 2.4%.

But there was one group of stocks that didn't participate in the gains. And sometimes you can tell more about the health of a rally by noticing the stocks that don't join in. 

The 2015 market leaders – the high-growth stocks that have marched higher throughout the year – didn't budge on Tuesday.

Facebook (FB) and Amazon (AMZN), stocks that are up 36% and 125% this year, respectively, were basically unchanged. Shares of Netflix (NFLX), which are up 140% for the year, fell 1.7% on Tuesday. And Alphabet (GOOG) – formerly Google – which is up 50% over the past 12 months, dropped 0.6%.

These "FANG" (Facebook, Amazon, Netflix, Google) stocks have held the stock market up all year. These are the stocks that portfolio managers should be anxious to show investors they hold in their portfolios at the end of the year. They should be the stocks that perform best in a year-end rally.

By not participating in Tuesday's big gains, the FANG stocks are suggesting this rally may not have far to run.

That could change, of course. Maybe the FANG stocks are just a little slow to get started. Maybe they'll play catch-up and resume their leadership roles. That would be a healthy sign for the market.

But I wouldn't count on it. The charts of these stocks look toppy.

For example, take a look at this chart of Facebook (FB) through Tuesday's close...

Please Enable Images to See this

After peaking at more than $107 per share in mid-November, FB formed a consolidating triangle pattern. That's a series of lower highs and higher lows. FB broke down from that pattern last week. Then, on Monday, the stock rallied back up to test the breakdown level as resistance.

If the stock were going to break through that resistance level and continue higher, then you couldn't have asked for a better backdrop than a big rally day in the broad stock market. But FB didn't participate. Now, the chart pattern looks bearish. Resistance has held, and the odds favor another push to the downside.

The charts of the other FANG stocks look similar.

We are in a strong, seasonally bullish time of the year for the stock market. We're coming off of extreme oversold conditions that should provide enough fuel to push the market higher through the end of the year.

But keep an eye on the FANG stocks. If they can't resume their leadership roles, then their weakness on Tuesday may be a warning that this rally will be short-lived.

Best regards and good trading,

Jeff Clark

Wednesday, December 16, 2015

The Most Contrarian Investment In The World Has Now Fallen To Unimaginable Levels

Today King World News is featuring a piece by a man whose recently released masterpiece has been praised around the world, and also recognized as some of the most unique work in the gold market.  Below is the latest exclusive KWN piece by Ronald-Peter Stoeferle of Incrementum AG out of Liechtenstein.
December 15 (King World News) – This Is Why The Situation With The Fed Is Scary As Hell!
A glance at the market capitalization of gold mining companies shows a similar valuation discrepancy. Currently, the Gold Bugs Index, which includes the 16 largest unhedged gold producers, is valued at a mere USD 55 billion. Compared to the S&P 500, this market capitalization is tiny, amounting to 0.3% of the index. The market capitalization of Microsoft alone is more than 6 times higher than that of all components of the Gold Bugs Index combined (see chart below).
KWN Stoeferle II 12:16:2015
KWN Stoeferle III 12:16:2015

KWN Stoeferle III 12:16:2015

Fed Hikes Rates, Unleashing First Tightening Cycle In Over 11 Years


On the 7th anniversary of entering ZIRP, and for the first time since June 29th 2006, The Federal Reserve announced today that it will try and raise interest rates:
*FED RAISES INTEREST RATES 0.25 POINT IN UNANIMOUS VOTE
Of course, the flowery language and dots are as dovish as possible while maintaining some semblance of credibility with regard growth expectations as The Fed unleashes a tightening cycle for the first time in over 11 years.
Pre-FOMC: S&P Futs 2050, 2Y 98bps, 10Y 2.29%, Gold $1072, Oil $36, EURUSD 1.0960


Heading into the decision, gold and silver suddenly started to fade, bond yields slid notably, and the USD jerked lower.
Fed Headlines:

*  *  *
What's happened since The Fed folded in September? Macro "data" got worse... Market "data" got better...

The Fed has never raised rates in December when stocks were down over the last 6 months...
h/t @RyanDetrick
And when it has raised rates in December, stocks have pushed lower.

The Fed is raising rates today with the VIX above 20 for the first time since 2000...

That did not end well...

The Fed is also raising rates with Junk bonds trading worse that after Lehman...

*  *  *

Sign of the Bottom – Finally – in Mining Stocks

Sign of the Bottom – Finally – in Mining Stocks
By Jason Goepfert, SentimenTrader
Monday, December 14, 2015
Conditions are bad in the mining sector...

Conditions are so bad that two of the leading players just resorted to the last-ditch effort of suspending their dividend payments.

This is an extremely rare occurrence. By the time sentiment has gotten this ugly, it has marked the final exhaustion in the last two down cycles.

Last week, Anglo American (LON: AAL) and Freeport-McMoRan (FCX) decided that (for the health of their companies' futures) they will stop paying dividends, cut their workforces, and try to survive. 

Next to fraud, this is about the last thing a company wants to admit. Dividends are considered sacrosanct – especially in this market environment where it's hard to get yield anywhere else. So they must really be desperate. 

That sounds like a bad thing, and perhaps it will be this time. But that's not what history suggests... 

It's not the first rodeo for either of these firms. They've both suspended their dividends at least once in the past 20 years. Freeport did so on December 9, 1998 and December 3, 2008. And Anglo did it on February 20, 2009. 

These dates roughly coincided with bottoms in metals and mining stocks, as you can see from this chart: 


In short, by the time the companies reached this desperate measure, metals and mining stocks had already been hit extremely hard (a company will never suspend a dividend in anticipation of tough conditions). 

By the time Freeport suspended its dividend in 1998, the S&P Metals & Mining Index was down 50% from its monthly closing high. In 2008, it was down 67%. Currently, it is down 69%. 

That tended to be about it for the selling pressure. A month later, the Metals & Mining Index was higher by 14%, 40%, and 12%, respectively. Six months later, the returns were much better. Take a look: 

S&P Metals & Mining Index
Signals (1995-2015)6 Months Later1 Year Later
1998-12-0921.1%31.5%
2008-12-0374.3%110.8%
2009-02-2042.3%67.4%
Mean45.9%69.9%
Copyright © 2015 Sundial Capital Research, www.SentimenTrader.com.

These dividend suspensions are exactly what potential shareholders should be looking for as a signal that sentiment is nearing a trough. 

Regards, 

Jason Goepfert

Amazing. Look at how silver has held its value for 23 centuries–

silver-coins-bars

Amazing. Look at how silver has held its value for 23 centuries–

Thousands of years ago in ancient city of Babylon, specially trained scribes gathered each day in the Temple of Marduk to record the day’s events.
They used cuneiform writing instruments and clay tablets, over 1200 of which still survive today.
These scribes kept excellent records, detailing astronomical observances and water levels of the Euphrates River, as well as market prices for the most popular commodities like wheat, barley, and wool.
It’s incredible that we have detailed records of grain prices going back thousands of years.
The ancient Babylonians quoted grain prices in shekels, a unit of weight equivalent to 8.33 grams of silver.
Over the 3+ century period between 384 BC and 60 BC, for example, the price of barley averaged 0.02053 shekels per quart in Babylonia.
At 8.33 grams per shekel, this would be equivalent to about 0.171 grams of silver per quart, or about $3.75 based on today’s silver price.
After converting the unit of measurement from ancient quart to modern hundredweight (cwt), that means that barley in Babylonian times sold for $5.23 per cwt when priced in today’s dollars.
And according to the US Department of Agriculture, yesterday’s price for barley was… $5.25 per cwt.
Amazing. When denominated in silver, the price of barley is almost exactly the same as it was thousands of years ago.
In other words, if a farmer from 23 centuries ago had sold a quart of barley, he would have received 0.171 grams of silver.
Fast forward to today and that 0.171 grams of silver would buy almost the exact same amount of grain as it did 23 centuries ago.
This is an important reminder, especially today as the entire financial system waits with baited breath to see if the US Federal Reserve will raise interest rates for the first time in nearly a decade.
It’s ultimately a complete farce. Our entire financial system is based on awarding total control of our money to a tiny, unelected committee of bureaucrats.
They have the power to conjure trillions of dollars, euros, yen, pounds, renminbi, etc. out of thin air that are backed by absolutely nothing other than a thin veneer of confidence.
Civilizations have been experimenting with this model for thousands of years. And every single time it has failed.
Future historians will certainly wonder why we chose a financial system based on a model with such a long history of failure, and why we gave control of our savings and economic activity to unelected bureaucrats who are consistently wrong.
When you step back and look at the big picture, this system is totally mad. And full of risk.
Governments are insolvent. Central banks are nearly insolvent. Banking systems are extremely illiquid. National pension funds are insolvent.
And their solution is to keep borrowing and printing more money.
Look, holding some physical cash does make sense right now as a *short-term* hedge against risks in the financial system.
If the GFC 2.0 hits, you’ll be glad that you’re holding some physical cash (more on this soon).
But how much do you think your paper currency will be worth 23 centuries from now? Or even 23 years? Or potentially even 23 months?
Bottom line– you’re not protected unless you own some real assets. Gold. Silver. Land. Productive business. This should be part of any rational person’s Plan B.

Saturday, December 12, 2015

1 oz Silver Round Coin Religious Cross Enameled Blue Pouch Capsule Ornament


1 oz Silver Round Coin Religious Cross Enameled Blue Pouch Capsule Ornament 

Product Details:
A beautiful arrangement of flowers adorn a plain silver Cross. 
Comes with a blue pouch and ornament capsule, perfect for giving as a gift!

Specifications:
Product ID: 78185 Year: N/A Grade: None Grade Service: None Denomination: 1 oz Mint Mark: N/A Metal Content: 1 troy oz Purity: .999 Manufacturer: Silvertowne Thickness: 2.87 mm Diameter: 43 mm Inner Pack: N/A Outer Pack: N/A 

Available at PGS Coins eBay Store:

http://www.ebay.com/itm/Christmas-Ornament-1-oz-Silver-Round-Coin-Religious-Cross-Enameled-Blue-Pouch-/301764250703?hash=item46428d0c4f

2014 Noah's Ark 1/4 oz Silver Coin Armenia 100 Drams Uncirculated

2014 Noah's Ark 1/4 oz Silver Coin Armenia 100 Drams Coin of Faith The Noah's Ark coin features supreme minting quality and purity produced by one of the most modern private mints of Germany.

Each coin is legal tender at its face value and is issued by the Central Bank of Armenia. 

Coin Highlights: Contains 1/4 oz of .999 fine Silver.
The obverse of the Noah’s Ark coin displays the coat of arms of the Republic of Armenia along with the value of “100 DRAM” and the issuing year beneath it.

The reverse of the Noah’s Ark coin was designed by Eduard Kurghinyan and displays a dove in flight with an olive branch and Noah’s Ark floating on the flood waters in front of Mt. Ararat and the rising sun.
Year: 2014
Grade: Brilliant Uncirculated
Denomination: 100 Dram
Metal Content: 0.25 troy oz
 Purity: .999
 Manufacturer: Geiger
Thickness: 2.5 mm
 Diameter: 20.2 mm

Available at PGS Coins eBay Store:

http://www.ebay.com/itm/Gift-2014-Noahs-Ark-1-4-oz-Silver-Coin-Armenia-100-Drams-Uncirculated-/291482040803?hash=item43ddaef9e3

Friday, December 11, 2015

1 oz Silver Round Coin U.S. Marines Enameled Gift Box & Capsule

Great Gift Idea! Brand New Uncirculated 1 ounce silver coin.

1 oz Silver Round Coin U.S. Marines Enameled Gift Box & Capsule

Product Details:
The United States Marine Corps is one of the most well respected military bodies in the world.
 This beautifully enameled 1 oz Silver round is an ideal way to honor any Marine in your life.
Round Highlights:
Contains 1 oz of .999 fine Silver.
Each round comes in a protective capsule with a gift box.
Obverse: Displays a red-enameled U.S. Marines’ logo surrounded by "United States Marine Corps."
Reverse: Blank center below "One troy ounce .999 fine Silver." Engrave-able to add a personalize message.
Specifications:
Product ID: 61192 Year: N/A Grade: None Grade Service: None Denomination: 1 oz Mint Mark: N/A Metal Content: 1 troy oz Purity: .999 Manufacturer: Silvertowne Thickness: 2.87 mm Diameter: 39 mm Inner Pack: N/A Outer Pack: N/A 


Available at PGS Coins eBay Store:

http://www.ebay.com/itm/1-oz-Silver-Round-Coin-U-S-Marines-Enameled-Gift-Box-Capsule-/301764269182?hash=item46428d547e

Coin 1 oz Silver Round - Candy Heart Enameled w/Box & Capsule

Great Gift Idea! Brand New Uncirculated 1 ounce silver coin.


Gift From the heart!
Great Gift for Holidays, Birthday, Wedding or Anniversary
Sweet Silver Gift!


 A Candy Heart Silver round is a perfect gift that comes from the heart and is something that can bring fond memories for years to come. The front of this Silver round depicts a heart-shaped box of candies, flowers and a bottle of wine, while the back of the Silver round is blank for engraving purposes. This Silver round includes a beautiful red presentation box and a capsule. This .999-fine Silver round makes a great Silver collectible or Silver gift. Buy a Candy Heart Silver round for your sweetheart or special someone today! 


Specifications Product ID: 60236 Year: N/A Grade: N/A Grade Service: None Mint Mark: None Metal Content: 1 troy oz Purity: .999 Manufacturer: Silvertowne Thickness: 2.87 mm Diameter: 39 mm

Available at PGS Coins eBay Store:

http://www.ebay.com/itm/Coin-1-oz-Silver-Round-Candy-Heart-Enameled-w-Box-Capsule-/291353750513?hash=item43d6096bf1

The system-wide credit default cycle is now unavoidable

Edited by J. Reeves | December 11, 2015 | Delray Beach, Fla.
  If you only read one of our 1,274 emails this year, make it this one [URGENT]


Editor’s Note: The numbers are in—last night’s emergency market briefing had the highest attendance in PBRG history. We’re pleased so many of you participated and received Tom’s free, personal crisis blueprint.
It comes not a moment too soon...
Below, you’ll find some of the top stories on the world economy today. As we march toward next week’s interest rate hike, keep an eye out for further deterioration in these “flashpoints.” They’re the issues Tom’s been preparing us for...


  The system-wide credit default cycle is now unavoidable
Market Black Hole
The “perfect storm” for a cascading bond and stock market crash is here.
Zero Hedge reports the credit default crisis—which started in the oil and gas space—has “metastasized” across the entire U.S. high-yield (HY) bond market.
At the same time, portfolio managers are holding the largest percentage of corporate bonds in history (35.8% of their total holdings).
Figure 1 below shows how distress (bonds trading over 1,000 basis points) has been spreading across the HY space. From its starting point in energy a year ago, it has now reached other commodity-sensitive areas such as transportation, materials, capital goods, and commercial services.
But it did not stop here and is also visible in places like retail, gaming, media, consumer staples, and technology—all areas that were widely expected to be insulated from low oil prices, if not even benefiting from them.
Chart

Bottom line: Change the word from “energy” to “housing,” and you’ve got last decade’s debt-fueled bust looming all over again...
Recommended Link
Last Chance: Claim $60,000 in Social Security Benefits—Or Lose it Forever
The US government just changed the rules on Social Security.

Over 32 million Americans are going to lose as much as $60,000 in benefits.

And you could be one of them.

You have a very short deadline to claim these benefits or lose them forever.

But the clock is ticking...

  Almost 70% of U.S. stocks are trading below their 200-day moving averages
Market
NorthmanTrader reports 68.2% of all New York Stock Exchange (NYSE) shares are trading below their 200-day moving averages (200 DMA).
And 52.4% of the S&P 500—the largest companies in the U.S. stock market—lie below their 200 DMA.
The 200-day moving average represents the average share price over the past 40 weeks. Traders view the measure as a major line of support—or resistance—for share prices.
In this case, it’s resistance to prices moving higher.
Chart

Bottom line: Two out of three U.S. companies trade below a line of steep resistance. That presents a strong headwind to stocks’ continued move higher.
  Global defaults surge to their highest level since the Great Recession
Balance on coins
U.S. companies have defaulted on $78 billion in debt so far in 2015.
That’s the highest number since the wake of the financial crisis in 2009.
Bloomberg reports the trend will continue upward in 2016... as increased borrowing costs make it more difficult to service their debts.
“The oil and gas sector accounted for 113 of the 361 issues in the distress ratio, because drops in oil prices affected profitability for oil and gas companies, where spreads have widened considerably, and had a spillover effect to the broader speculative-grade spectrum,” Diane Vazza, head of Standard & Poor’s Global Fixed Income Research Group, said in a report.
The distress ratio, along with other economic, financial and credit conditions, indicates “growing pressure” that the number of defaults might rise, according to the report.
Chart

Bottom line: The rates of both distressed and defaulted junk bond debts rose in 2015... and are set to grow even higher in 2016. The higher these numbers go, the more fragile the entire financial system becomes.
  The central banks’ central bank warns: Uneasy market calm masks a “debt time bomb”
Debt Bomb
The Telegraph reports the Bank of International Settlements (BIS)—the central bank of the world’s central banks—warns the risk for global financial contagion from rising interest rates in America is spiking.
The central bank watchdog said emerging market households and businesses reliant on cheap debt faced a credit crunch that could trigger panic in a world of evaporating liquidity and fewer market makers.
Public and private debt in the developed world has risen 36% since the 2008-2009 crisis.
It’s now 265% of gross domestic product (GDP).
Chart

Bottom line: As rates rise, the dollar will grow even stronger against other currencies. That makes foreign markets’ debts much harder to pay... and could lead to a chain reaction of defaults.
  The tipping point: The U.S. middle class is now a minority
Suburban Houses
NPR reports 2015 marks the first year under half the U.S. population is considered middle class.
The U.S. now has 120.8 million middle-class adults. That’s less than the 121.3 million in the upper- or lower-class brackets.
And the trend’s not slowing down...
“The hollowing of the middle has proceeded steadily for the past four decades,” Pew concluded.
Middle-income Americans not only have shrunk as a share of the population but have fallen further behind financially, with their median income down 4 percent compared with the year 2000, Pew said.
Chart

Bottom line: Middle-class incomes are still lower than they were almost 16 years ago... with no relief in sight.
Folks, it’s just not safe out there right now. That doesn’t mean you should panic, sell everything, and move out to the hills. But you must take care to protect your wealth right now.
If you missed our emergency market briefing, you’ve got one last opportunity. Tom’s instructed us to replay the briefing for anyone who wants access to his personal crisis-investing blueprint. Tomorrow will be your last chance to participate. Click here to reserve your spot.
  Readers share their crisis strategies in today’s interesting mailbag...
Mailbox
Reeves’ Comment: Last week we asked our subscribers to share how they’re preparing for the Fed’s interest rate hike... and its ensuing volatility.
Here are some of their responses (the feedback was anonymous):
  • “Stop losses on all stocks.”
  • “I’m holding very few equities... lots of precious metals... and a solid group of put options.”
  • “I hold the Guggenheim inverse U.S. bond long fund.”
  • “Asset allocation is key! Here’s mine: gold, real estate, and Legacy stocks. No REITs, telecoms, or bond funds.”
  • “I’ve raised cash in my accounts to cover my anticipated expenses over the next year. I’m also investigating Income for Life (IFL) as a way to get out of the market completely. I like that I can use it to save and invest outside of the stock and bond markets.”
  • “I need to purchase gold and silver. But I’m a sitting duck with my 401(k) and TD Ameritrade accounts. Not sure if I’m in the right investments...”
  • “I’m keeping one-third cash, one-third precious metals, and one-third stocks.”
  • “Trailing stops. I’m not buying much right now. I’ve got 40% in cash.”
  • “I’d like to invest in Income for Life, as you recommend.”
It’s encouraging to read these comments. It sounds like a lot of our advice on risk management and diverse asset allocation has been sinking in. That’ll help offset a lot of market volatility.

Palm Beach Research Group
Edited by J. Reeves | December 11, 2015 | Delray Beach, Fla.