We are living in a time of earthquakes that could crush the walls of your portfolio and leave your wealth in ruins.
Tragically, major earthquakes have struck in recent days in Japan and Ecuador, causing death and destruction. We’re concerned about these, but we’re also concerned with financial earthquakes, which are also happening everywhere.
Financial earthquakes are just as dangerous to your wealth as physical earthquakes are to your well-being. Physical earthquakes can have ramifications in capital markets as well.
Let’s survey this new age of earthquakes and help you to find shelter from the ruin and the aftershocks.
On Thursday, April 14, a large magnitude-6.2 earthquake struck Japan on the southern island of Kyushu near Kumamoto City. Fortunately, there was relatively little loss of life. But the city was left without electricity, and extensive damage to buildings and roads was reported.
Then on Saturday, April 16, a much more powerful magnitude-7.0 earthquake struck the same area of Japan around Kumamoto City. Now the loss of life was greater, with at least 32 killed, and over 2,000 were injured. At least 180,000 people lost homes and were seeking shelter. Over 1,000 buildings were badly damaged and over 90 completely destroyed.
With hindsight, scientists could see that the April 14 earthquake was a foreshock and the April 16 earthquake was a major shock. The two earthquakes are an example of how events in complex systems interact in ways that are impossible to predict.
Within hours of the April 16 earthquake in Japan, a massive magnitude-7.8 earthquake struck the northwestern coast of Ecuador. Casualties included over 350 dead, and that toll is expected to rise. At least 370 buildings were totally destroyed, and thousands more damaged.
Ecuador is a relatively poor country, so the global economic fallout is expected to be minimal despite the horrendous suffering of those on the scene.
While the two earthquakes in Japan are clearly connected, scientists do not see any direct connection between the Japanese and Ecuadorian earthquakes. Yet there is no doubt that Japan and Ecuador are part of a single system that produces earthquakes on a continual basis.
Japan and Ecuador are both part of the “Ring of Fire” consisting of 25,000 miles of volcanoes and fault lines that circle the Pacific Ocean. The Ring of Fire stretches from Chile, northeast through the west coasts of North and South America, through Alaska, and then south through Japan, Indonesia and finally New Zealand.
The “Ring of Fire” is a band of volcanoes and fault lines that surrounds the Pacific Ocean. It is a good example of a complex system. Financial markets are also complex systems that exhibit connected behavior with timing that is impossible to predict.
These events may be front-page news, but what does seismology have to do with your portfolio?
Earthquakes and capital markets are both representative of complex dynamic systems. There’s a great deal we can learn about capital markets by studying earthquakes using a complexity theory framework. Complexity theory is one of the tools I use to understand risk and make financial forecasts.
There is a lot scientists know about earthquakes and a lot they don’t know. It is possible to identify fault lines, which enables scientists to locate potential earthquakes. It is also possible to estimate the potential size of future earthquakes based on the extent and nature of the fault lines.
The one thing scientists cannot predict is the exact timing of an earthquake.
They can tell you a big one is coming, and they can tell you where, but they cannot say exactly when. A monster earthquake could happen tomorrow, next year, in five years or even further in the future.
Does this make scientific knowledge of earthquakes useless? After all, investors always say timing is everything when it comes to buying or selling stocks. If you cannot predict the exact timing, what good is the science?
The answer is that you can make good use of what you do know, even if there are factors you do not know. For example, you may not know when an earthquake will strike on a particular fault line. But you do know it’s not a good idea to build a nuclear reactor right on top of one. The earthquake will strike eventually, and the reactor will melt down. It’s foolish to add to the known risks just because the exact timing is unknown.
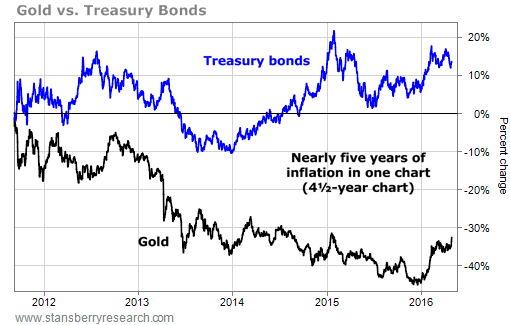
The same is true in financial markets. We can see a financial meltdown is coming and we know how bad it will be. We do not know the exact timing. Although it would be surprising if we made it three years without the equivalent of a magnitude-9.0 financial earthquake. (If the Lehman Bros. and AIG meltdowns of 2008 were an 8.0 financial earthquake, you can imagine how much worse a 9.0 will be.)
If a financial earthquake worse than anything you’ve seen before is definitely coming, then the timing is irrelevant. Since it could be tomorrow, you need to prepare today with strategies that will either preserve wealth or make money when the “big one” hits.
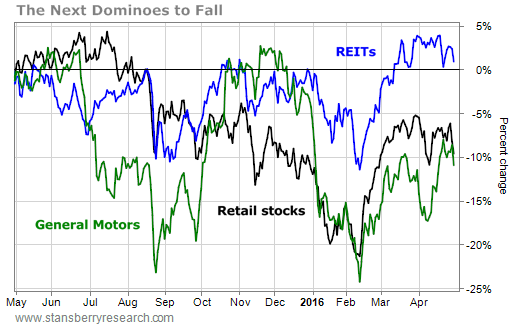
This limited but powerful knowledge (we know size and likelihood, but not timing) is not the only common feature of seismology and finance. Both types of complex systems cause “contagion” or “spillover” effects. This is where one surprise event causes other shocks, just like dominoes falling or a house of cards collapsing.
The Russian/Long-Term Capital Management panic of August 1998 actually started in Thailand in June 1997. It then spread around the world. The Lehman/AIG panic of September 2008 actually started in the mortgage market in July 2007. Then it spread through Bear Stearns and Fannie Mae before becoming a full-scale panic.
The next global panic may have started already, but we won’t see the full scope of it for a year or more.
Sometimes natural disasters and capital markets interact directly. This is a case of one complex system crashing into another. The most spectacular example of this is the Fukushima disaster in Japan in March 2011.
Fukushima began as an underwater earthquake that morphed into a tsunami. The tsunami then crashed into a nuclear reactor that melted down. The reactor meltdown caused a crash on the Tokyo Stock Exchange and a surge in the value of the yen. The yen spike then triggered a G-7 currency market intervention to weaken the yen in an effort to help the suffering Japanese economy.
The earthquake, tsunami, reactor, stock market and foreign exchange are all examples of complex dynamic systems. Two are natural (earthquakes and tsunamis) and three are man-made (reactor, stock market and foreign exchange), yet they all crashed into each other as if they were just one row of dominoes.
This shows the power of complexity and its ability to shock and surprise investors.
Something similar happened as a result of the recent Japanese earthquakes. We had already alerted readers about the “Shanghai Accord,” a secret plan agreed among central bankers at the G-20 meeting in Shanghai, China, on Feb. 26. One of the main objectives of the Shanghai Accord is a strong Japanese yen.
While the Japanese earthquake had nothing to do with the Shanghai Accord, there was a direct and powerful market connection.
When earthquakes strike, insurance companies need to liquidate assets in order to pay claims. After April 14, Japanese insurance companies began selling overseas assets, converting the proceeds into yen and repatriating the yen in order to pay claims and finance rebuilding. This liquidation and repatriation gave us a new data point to update our Shanghai Accord thesis pointing to a stronger yen.
That thesis is now stronger.
I use a method called inverse probability to make forecasts about events arising in complex systems such as capital markets. Inverse probability is also known as Bayes’ theorem, based on an early 19th-century formula first discovered by Thomas Bayes. The formula looks like this in its mathematical form:
In plain English, this formula says that by updating your initial understanding through unbiased new information, you improve your understanding. I use this method in the CIA and in my financial forecasting.
The left side of the equation is your estimate of the probability of an event happening. New information goes into right-hand side of the equation. If it’s consistent with your estimate, it goes into the numerator (which increases the odds of your expected outcome). If it’s inconsistent, it goes into the denominator (which lowers the odds of your expected outcome).
What are some of the financial fault lines we are monitoring right now? What are the new data points that are going into the Bayes model to update our forecast of a financial meltdown?
Here’s a list of the main fault lines leading to disaster:
- Brazil is undertaking impeachment proceedings to remove President Rousseff from office. Brazil is the ninth-largest economy in the world. It is a major energy exporter and an important member of the BRICS, G-20 and other key multilateral organizations. Uncertainty in Brazil means uncertainty for the entire global economy
- A June 23 referendum in the U.K. is heading toward the U.K. leaving the EU. This will cause shock waves in Europe and may lead to a complete loss of confidence in pounds sterling. Spillover effects include Scotland leaving the U.K. once the U.K. leaves the EU. In that case, Scotland may join the eurozone, which, ironically, could make the euro stronger despite the U.K.’s departure
- On April 15, The New York Times reported that Saudi Arabia threatened to dump hundreds of billions of dollars of U.S. Treasury securities on the market if the U.S. Congress proceeds with a vote to allow 9/11 victims to sue the Kingdom of Saudi Arabia in court. (Right now the Kingdom enjoys certain immunities, which make such lawsuits impossible.) This dumping could cause liquidity to dry up in the Treasury market, with a potential spike in interest rates and investor losses that would make the panic of 2008 look like a picnic.
There’s more, but that’s enough of a list to make the point that confidence in my forecast of a major financial earthquake ahead is getting stronger by the day.
Regards,

 \
\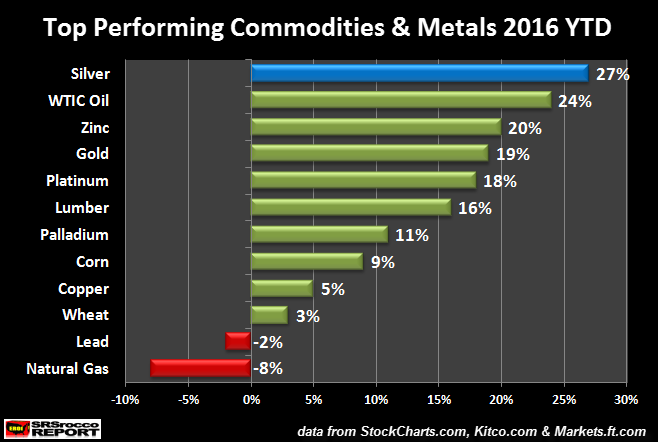
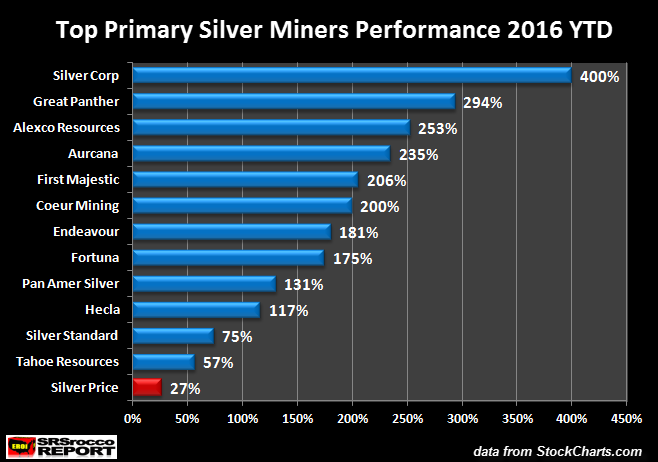
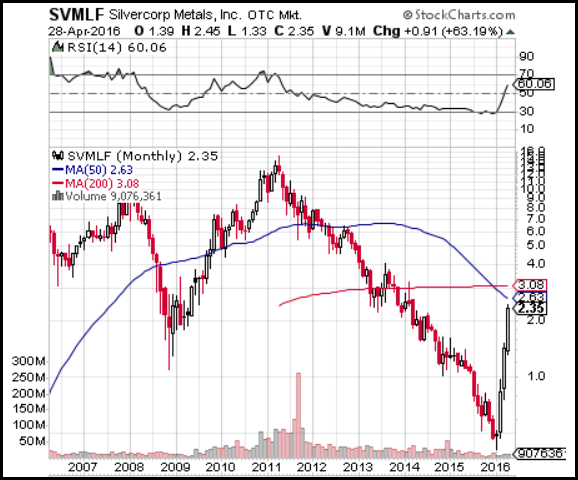 At one point, Silver Corp Metals reached $15 in April 2011. But, over the next five years fell to a low of $0.41 in January this year. Silver Corp Metals increased from $0.47 on Dec 31st 2015 to $2.35 on April 28th 2016. Again, this was an impressive 400% move in less than four months.