Is gold off the bottom?
No one knows for sure. If the Fed raises interest rates on Thursday (which we do not expect), the effect will be highly deflationary and gold prices could move lower, at least temporarily.
Conversely, if the Fed doesn’t raise rates and offers some reason to believe it won’t raise them for the foreseeable future (so-called “forward guidance”), then gold prices could rally in anticipation of inflation.
It’s unfortunate that markets are now reduced to reading Janet Yellen’s mind. But that’s what happens after seven years of market intervention and central planning by the Federal Reserve.
Using my system, which combines complex dynamic systems analysis with unique access to relevant information, we’re able to draw some useful inferences about the future path of gold prices. Our estimate is that gold has now found a bottom and is poised to move steadily upward from current levels.
For those who are fully allocated in physical gold (I recommend about 10% of investible assets), there’s nothing more to do on that front. You can just sit tight and enjoy the ride.
For those who do not have the recommended allocation to physical gold, this is an attractive entry point and a chance to top up your allocation at the best prices in six years.
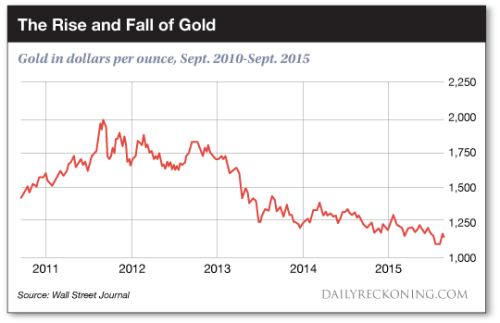
It’s certainly been a long and volatile ride for gold investors. Starting from a low of about $250 per ounce in mid-1999, gold staged a spectacular rally of over 600% to about $1,900 per ounce by August 2011. Unfortunately, that rally looked increasingly unstable toward the end.
Gold was about $1,400 per ounce as late as January 2011. Almost $500 per ounce of the overall rally occurred in just the last seven months before the peak. That kind of hyperbolic growth is almost always non-sustainable.
Sure enough, gold fell sharply from that peak to below $1,100 per ounce by July 2015. The 15-year chart still shows a gain of about 350%, but the four-year chart shows a loss of over 40%.
Those who invested during the 2011 rally are underwater, and many have given up on gold in disgust. For longtime observers of gold markets, sentiment is the worst they’ve ever seen.
At
Currency Wars Alert, we look
behind the charts and sentiment and try to discern the systemic dynamics driving the price. Once those dynamics are specified, forecasting becomes much more reliable.
We’ve identified three factors that well explain the gold price dynamics. These three factors are real interest rates,dollar strength and central bank intervention. Looking at the current status and likely path of these factors is the best guide to the future price of gold.
Real interest rates are one of the best predictors of the nominal dollar price of gold. When real interest rates are low (or negative), that gives gold a boost. When real interest rates are high, that puts downward pressure on gold.
The correlation is not perfect, but it’s much stronger than other correlations such as the stock market or economic growth. The reason for the correlation is easy to understand. Gold has no yield. Gold’s valuation has to compete with other asset classes such as stocks and bonds that do have yields. When yields on competing asset classes are higher, the gold price tends to suffer, and vice versa.
What matters for this purpose is not thenominalrate of interest but therealrate. Real interest rates are defined as the nominal interest rate minus inflation. For example, if the nominal interest rate is 5%, but inflation is 3%, then the real rate is only 2% (5% minus 3%). That sounds simple enough, but there are complications.
In selecting nominal interest rates, you have to specify a maturity. Rates on 2-year Treasury notes are much lower than rates on 10-year Treasury notes. We use the 10-year note rate for our analyses because it’s a good proxy for mortgage rates and corporate bond rates, which represent the cost of financing long-term investments in housing and fixed assets by individuals and corporations. It makes more sense to think about gold as a long-term core holding than as a short-term trading instrument.
The other complication arises when the rate of inflation is greater than the nominal rate of interest. In that case, the real rate is negative. This could happen when the 10-year note rate is 1% and inflation is 2%.
In that case, the real rate is negative 1% (1% minus 2%). That is the ideal environment for gold. A zero yield on gold is actually greater than the negative real yield on notes.
Wall Street analysts keep talking about how low interest rates are. It’s true that nominal rates are low, but real rates are quite high by historic standards. For the past several years, 10-year nominal rates have mostly been over 2%, but inflation has been about 1%, sometimes lower.
This means that the real rate on 10-year notes has been over 1%. Compare this to the situation in 1980 (when gold hit a new high of $800 per ounce). Back then, Treasury bonds yielded 13%, but inflation was 15%, so the real rate wasnegative 2%. Don’t be misled by low nominal interest rates. Focus on the real rates instead and you’ll have better insight into the future price of gold.
The second factor is dollar strength. There the correlation is even more striking. If you consider gold to be a form of money or currency (which we do— that’s why we cover it in
Currency Wars Alert), then it’s easy to see that a strong dollar signals a weak dollar price of gold, and a weak dollar signals a strong dollar price of gold.
The best measure of dollar strength (other than gold itself) is the Price-Adjusted Broad Dollar Index maintained by the Federal Reserve Board.
The all-time low for this dollar index was 80.5001 in July 2011, the time of which corresponds exactly with the all-time high dollar price for gold.
Conversely, that index today reads 95.595. That’s the highest reading in over six years. Not surprisingly, just as the dollar is at a six-year high, gold is near a six-year low. Again, the correlation is not perfect, but it is surprisingly robust.
Wall Street analysts have tended to select the wrong dollar indexes in doing their analysis.
The Wall Street indexes are heavily weighted toward the euro and yen, whereas the Fed’s index looks at emerging markets including China. At
Currency Wars Alert, we’ve used the Fed index all along. A glance at Page 253 of my book
The Death of Money confirms that we’ve always used the right index tool.
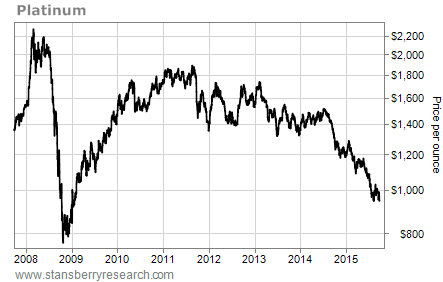
The third factor is central bank intervention. Here the case is straightforward: a simple matter of supply and demand. Mining output has been remarkably constant over recent decades: about 2,000 tons per year.
Gold has very few industrial uses. I consider jewelry to be “wearable wealth,” so I do not distinguish between jewelry demand and bullion demand — both are forms of wealth preservation. So with constant output and variable demand for gold as a store of wealth, it has been relatively easy for central banks to manipulate the price of gold by dumping gold reserves on the physical market at critical junctures.
There have been three major waves of central bank manipulation in the physical market.
The first was the London Gold Pool of the 1960s, which collapsed in 1968.
The second was a covert effort by the U.S. and IMF to dump 1,700 tons of gold on the market from 1975-79 to disguise the real impact of inflation. This collapsed in 1980 when both inflation and the price of gold spun out of control.
The third effort was the Washington-inspired “Central Bank Gold Agreement” (CBGA), which formed a seller’s cartel of 11 national central banks (not including the U.S.).
The CBGA was created in 1999 and renewed in 2004 and 2009. The largest seller under CBGA was Switzerland. This agreement has now failed, and there have been no sales by any of the signatories since 2010.
Since then, central banks have moved from being net sellers to net buyers for the first time in decades. With few official sellers and many official and nonofficial buyers, gold demand now exceeds gold supply from mines, putting pressure on scrap gold and other weak hands to fill the gap.
The importance of this analysis is that it doesn’t focus on where we are. It focuses on where we’re going. Central banks cannot tolerate high real interest rates, because they burden consumption and investment.
The Federal Reserve cannot tolerate a strong dollar because it imports deflation (in the form of lower import prices) from around the world. Physical markets are skewed toward excess demand because China, Russia, Iran and other countries continue to demand gold to diversify reserves away from dollars while output is flat and official sales by the West have ceased.
All three factors — real rates, the strong dollar and official sales — are pointing toward a reversal of recent trends and momentum toward conditions that favor higher gold prices.
Gold can move in either direction, but it is much more likely to move up than down given current conditions.