Today top Citi analyst Tom Fitzpatrick sent King World News 4 remarkable bullish charts on metals, platinum, oil and commodities.
But first, Fitzpatrick’s perfect March 9th bullish call on commodities…
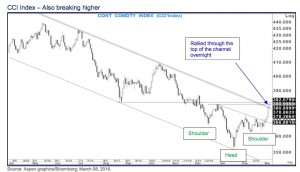
Top Citi analyst Tom Fitapatrick sent KWN this note on March 9th, when he turned bullish on commodities: The Continuous Commodity Index (CCI) rallied through the top of the channel and has a reverse head and shoulders pattern that targets 395. Overall the chart below is pointing towards a positive market outlook (for commodities) (see chart below).
Fast forward to today’s call from top Citi Analyst Tom Fitzpatrick…
Platinum
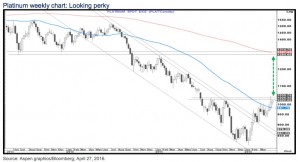
Platinum has broken out of the 2 year down channel and above the 55 week moving average for the first time since August 2014. It is now testing strong horizontal resistance around $1,022 – $1,035. A weekly close above here, if seen, would suggest the potential for extended gains towards $1,300 again (see chart below).
Platinum has broken out of the 2 year down channel and above the 55 week moving average for the first time since August 2014. It is now testing strong horizontal resistance around $1,022 – $1,035. A weekly close above here, if seen, would suggest the potential for extended gains towards $1,300 again (see chart below).
Continuous Commodity Index
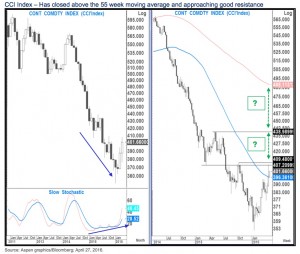
Indications of a turn higher were further supported by the weekly close above the 55 week moving average for the first time since July 2014. We have a very large gap to the 200 week moving average which is currently at 488 – some 20% above current levels (see chart below).
Indications of a turn higher were further supported by the weekly close above the 55 week moving average for the first time since July 2014. We have a very large gap to the 200 week moving average which is currently at 488 – some 20% above current levels (see chart below).
Oil
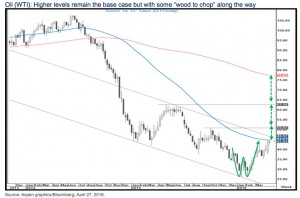
Last week Oil posted a bullish outside week as a continuation of the trend and this week the 55 week moving average is being tested ($44.61). A close above that moving average on a weekly basis and in addition the channel top at $46.57 would suggest extended gains towards at least $51 (October 2015 highs) and possibly towards $62.50 (May 2015 highs) (see chart below).
Last week Oil posted a bullish outside week as a continuation of the trend and this week the 55 week moving average is being tested ($44.61). A close above that moving average on a weekly basis and in addition the channel top at $46.57 would suggest extended gains towards at least $51 (October 2015 highs) and possibly towards $62.50 (May 2015 highs) (see chart below).

London Metals ExchangeBelow is the long term chart of the London Metals Exchange Index. There are a number of factors that suggest that the long term low is in:
*The time between the major lows was exactly 7 years and 1 month (2001, 2008 and Jan 2016).*Monthly momentum turned up from stretched levels last seen at the lows in 2008 and 2001.*We held the 76.4% retracement of the rally from 2009.*At that level we posted a bullish monthly hammer pattern in January (see chart below).
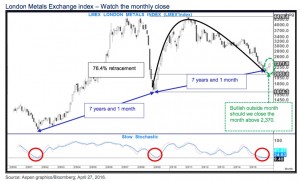
The important development to look out for now is this month’s close. Should we see it above 2,370 then we would see a bullish outside month as a continuation arguing for further gains from here.
King World News note: It’s important to note that the coming bullish action in platinum, oil, commodities and metals will be extremely bullish for both gold and silver.

No comments:
Post a Comment