| Editor's note: The Fed's decision to raise interest rates is good news for U.S. stocks. And as Steve Sjuggerud explains in today's Masters Series essay – excerpted from his brand-new book – it's bullish for precious metals, too…  Higher Interest Rates Give Us a Fantastic Opportunity in Precious Metals By Steve Sjuggerud, editor, True Wealth Simple logic would tell you to sell precious metals when interest rates rise, not buy them. Logically, this "easy-money" policy should be pro-precious metals. Although the government can print money and lower interest rates, the supply of precious metals stays roughly stable. Owning precious metals doesn't pay you anything. When rates are near zero, there's no penalty for owning precious metals. When interest rates rise, on the other hand, you're giving up a potential yield on your money in order to hold precious metals. That yield should discourage precious metals demand and hurt precious metals prices. The problem is, markets don't always work based on simple logic. And in the case of gold and silver, Fed tightening actually gives us a fantastic opportunity. I looked at more than 40 years' worth of data – from 1973 to 2015. I looked at all the times the U.S. moved from a period of low or falling rates into a period of rising rates. The next tables show what gold and silver did during all periods when the Fed raised (or tightened) rates versus all periods when the Fed lowered (or eased) rates. Take a look…
As you can see, both gold and silver perform better during periods of tightening than periods of easing. And it's not just for the entire period of Fed tightening. Gold and silver also outperform just as the Fed begins tightening… like we'll see when the Fed raises rates. The next tables show what gold and silver did during the three-month and one-year periods when the Fed first started easing or tightening. Take a look…
In the three months after tightening begins, gold returns 7.1% and silver returns 10.6% (based on median gains). That's incredible when you consider the typical three-month return for both metals is well below 1%. Even a year later, these metals beat the historical returns. It seems crazy… but owning gold and silver as the Fed begins tightening is exactly what we want to do! The data is clear. We want to own precious metals when the Fed begins tightening… and during the entire period of tightening. On top of that, there is another catalyst for gold and silver in our favor… It helped drive gold and silver's bull market during the 2000s. And it isn't going away any time soon… One Driver of the Precious Metals Bull Market Gold increased 2.5% in 2001. That was the first positive annual gain in gold prices in five years. Gold hadn't had a winning year since 1995. But that meager 2001 rise kicked off a massive bull market. As you probably know, gold prices increased every year from 2001 to 2012. Silver prices were more volatile, but on the whole, they increased over the same 12 years. Take a look…
As you can see, gold and silver averaged 17% and 20% annual gains during this massive bull market. But after more than a decade of gains, things came to a screeching halt in 2013. Gold fell 28% in 2013. Silver plunged 36%. And it continued in 2014… gold fell 2% and silver fell 19%. By mid-2015, no one was interested in gold. Most folks had given up on gold and silver. But what they didn't realize was the catalyst that propelled these precious metals higher over the previous decade was still present in 2015… If you look back at history, gold and silver's major bull markets all have one key distinction… they happened during periods of negative real interest rates. Let me explain what that means… The real interest rate is the risk-free return on money after inflation. It's what you can earn on cash in the bank after inflation lowers your purchasing power. You calculate this number by taking the inflation rate (the Consumer Price Index, or CPI) and subtracting short-term interest rates (in this case, the Federal Funds Rate). When inflation is lower than interest rates, the real interest rate is positive. But when inflation is higher than interest rates, the real rate is negative. And precious metals thrive during periods of negative real interest rates. You can see this in action in the next chart. It shows gold prices versus the two major periods of negative real interest rates (in gray). Take a look… 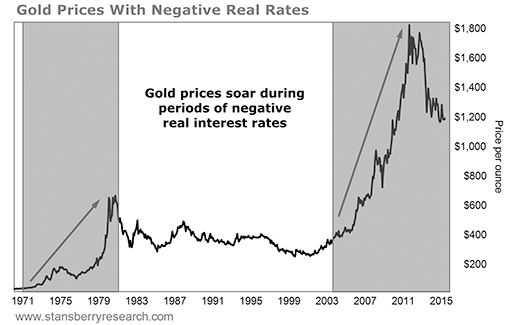 As you can see, both of gold's major bull markets occurred during periods of negative real interest rates. When real interest rates were positive, gold went nowhere. Silver is the same story… 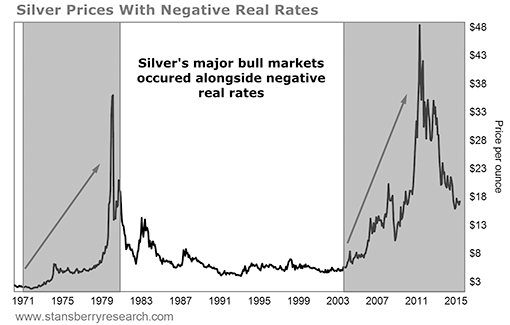 Once again, silver prices soar when real interest rates are negative. The numbers back up what the charts show… From 1970 to 2015, gold returned roughly 8% a year. And silver was up just 6% a year. But buying in times of only negative real interest rates led to much better returns. Take a look…
Gold's one-year negative real rate return of 11.9% is more than four times better than its positive real rate return of just 2.8%. And that relationship holds over most time frames, as the table shows. The same is true for silver.
The median six-month and one-year gains when buying during positive real rates is NEGATIVE for silver. Just about all our gains come during periods of negative real interest rates. From 2013 to 2015, gold and silver prices fell despite negative real interest rates. But that doesn't change the facts… Gold and silver historically perform best when real interest rates are negative instead of positive… and negative real rates aren't going anywhere anytime soon… As of mid-2015, inflation is 0%. But analysts expect inflation to rise above 2% by 2016. The Fed's own estimates put interest rates at just 1.25% in 2016 and 2.75% at the end of 2017. That means we'll likely see negative real interest rates through 2017, at least. And that gives you a great historical opportunity in precious metals. In short, precious metals should do well over the next few years. We've got two powerful historical winds at our back…
Good investing, Steve Sjuggerud | ||||||||||||||||||||||||||||||||||||||||||||||||||||||||||||||||||||||||||||||||||||||||||||||||||||||||||||||||||||||||||||||||||||||||||||||

SUZI Q'S ESTATE FINDS
Sunday, January 31, 2016
Higher Interest Rates Give Us a Fantastic Opportunity in Precious Metals
Subscribe to:
Post Comments (Atom)
No comments:
Post a Comment