With the Dow tumbling more than 500 points, the global stock market rout continues as panic begins to engulf the world.
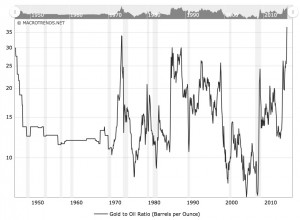
And there goes the Gold/Oil ratio as it hits another 70-year high!

The Gold/Oil ratio had already taken out the high from July of 1973 (33.69), and today it is now trading at 36. Again, people will see gold float across the ticker at roughly $1,100 and think it’s weak but it’s actually trading quite strong vs key commodities such as oil.
Regarding the oil market, just three days ago Art Cashin warned King World News that the carnage may get worse:
“As we talk shortly here in the afternoon, we are just above $30. If the price of oil breaks $30 it could lead to a little bit of cascade selling and that would be a real problem. There are certain derivatives that are triggered when oil breaks certain price levels. It actually brings on more selling in oil as entities are forced to liquidate certain positions.
The thing that I am concerned about is if the price of oil breaks $30, does it lead to a kind of trapdoor, and is there subsequent selling?”
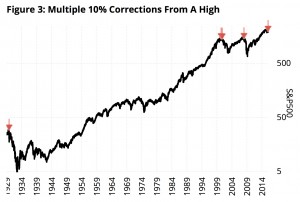
Regarding the massive wealth destruction that has taken place in global markets, this MAJOR ALERT was posted on KWN just two days ago: The warning signal preceding global stock market crashes in 1929, 2000 & 2008 was just triggered!
 Action Mirrors 1929, 2000 & 2008 Stock Market Crashes!
Going back to 1928, this has only happened on four other dates, October 1929, May 23, 2000, October 11, 2000 and January 8, 2008. As shown in Figure 3, these were dates that should send a shiver down the spine of any bull (see stunning chart below).

And here is what the man who advises the most prominent sovereign wealth funds, hedge funds, and institutional funds in the world told King World News days ago:
“I have a forecast model that I developed. We used it in proprietary trading at Solomon Brothers when I was there, and for 20+ years I’ve been advising the top funds in the world. That was one of the first things I did (developed my own proprietary trading model) when Laszlo Byrini hired me at Solomon Brothers in the 1980s.
And markets will tend to revert to their long-term averages in bear markets. How far down is that? That’s the 200-month average. The 200-month average is where the Nasdaq went in 2009, and also in the tech crash in 2002.
 The Carnage In Global Markets Will Get Worse
So how far down is that? Down 50 percent. The Nasdaq could be cut in half. For Apple, it’s down 65 percent — that’s where the 200-month average is. For the DAX, the German stock market, down 37 percent. For the FTSE Mid-Cap Index, which is the benchmark for the hedge funds over there in London, down over 43 percent. For the Nikkei, down 38 percent. For the S&P, down 32 percent.
So basically a 35 – 50 percent downside risk (in global markets) over 12 – 18 months. That would be a normal bear market collapse where things go back to a mean and you turn into a buyer. I am not a perma-bear. I was incredibly bullish at the 2009 bottom. At that bottom I was saying the exact opposite of what I’m saying now. I was saying, ‘Buy financials, buy techs.’ That was what I was telling institutional investors back then.
Now I’m saying the exact opposite, ‘Sell techs, sell rallies, sell stock indexes, be short, don’t be long. Own Treasuries, gold, and be as defensive as you can.’ There is very little safe ground here. It’s like you’re in the middle of quicksand and you are looking for something to stand on while everybody else is sinking around you. And unfortunately most institutions are not positioned correctly. The next 12 – 18 months are going to be a real shakeout.
 Massive Deleveraging And The Opportunity In Gold
When people are overly-positioned in the wrong stuff, it’s their liquidation that drives prices into the ground. And what drives a bear market is deleveraging. We have a huge amount of margin debt at the moment. We still have $471 billion of NYSE margin debt. Someone gets a margin call and they are forced to sell. Somebody else then gets a margin call and they are forced to sell and it turns into this vortex of selling.
So that is what I think lies ahead for the global markets and we’ll get into gold a bit later because now I think that’s where the opportunity is on the long side.”

No comments:
Post a Comment